
Fig. 2.
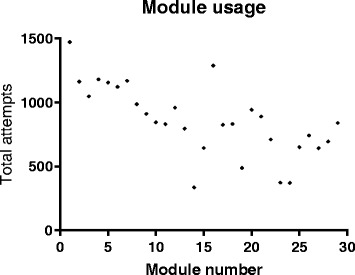
Overall usage of each of the online modules. Graph showing the total number of times each module was attempted throughout the semester. Modules are numbered in the order of release
Official websites use .gov
A
.gov website belongs to an official
government organization in the United States.
Secure .gov websites use HTTPS
A lock (
) or https:// means you've safely
connected to the .gov website. Share sensitive
information only on official, secure websites.
Overall usage of each of the online modules. Graph showing the total number of times each module was attempted throughout the semester. Modules are numbered in the order of release