
Figure 6.
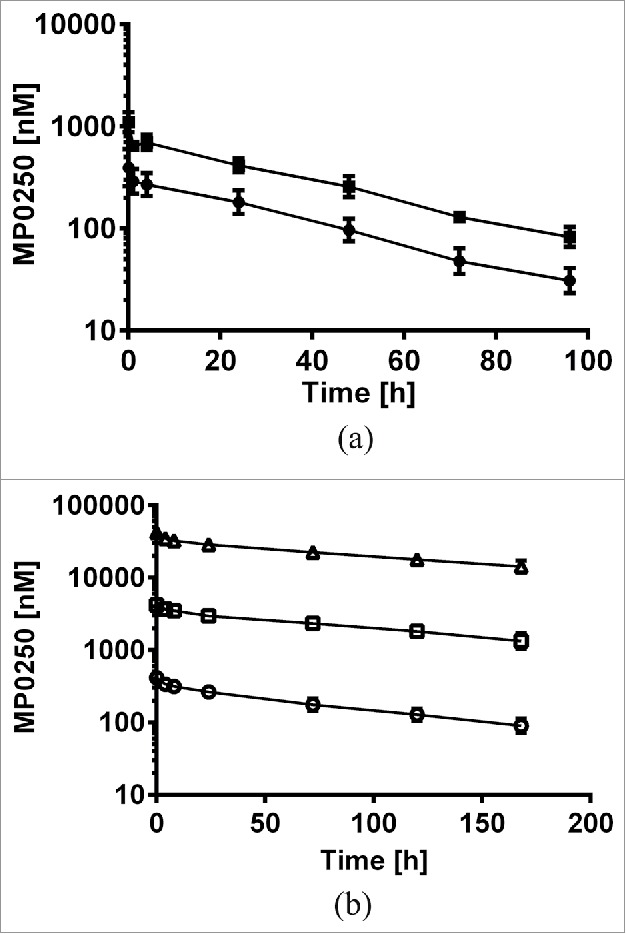
Concentration-time profiles of MP0250. (a) Mouse pharmacokinetic profile of MP0250 at 1 mg/kg (filled circles) and 2 mg/kg (filled squares). (b) Cynomolgus monkey pharmacokinetic profile of MP0250 at 1 mg/kg (open circles), 10 mg/kg (open squares), and 100 mg/kg (open triangles). Mean concentrations and standard deviations are plotted over time. Pharmacokinetic parameters derived from the experiments are given in Table 3.