Figure 5.

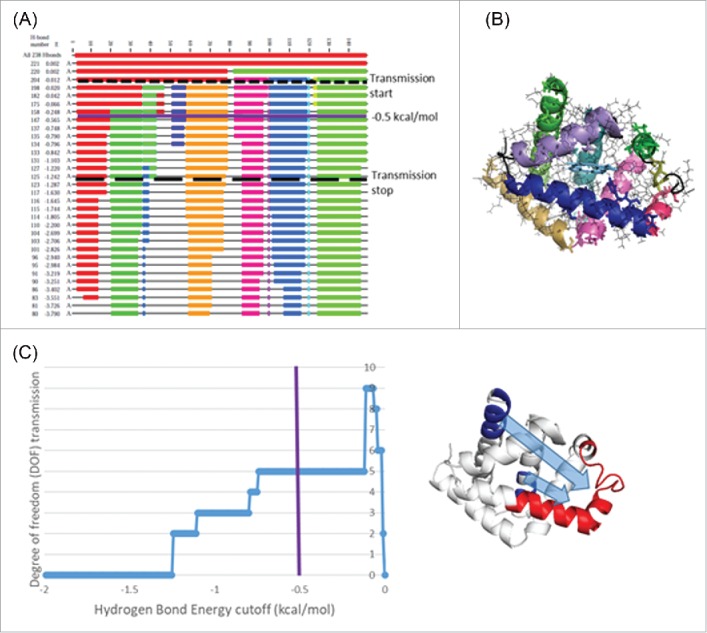
Computational allostery predictions using RTA analysis. (A) Dilution plot of myoglobin (3rgk) using FIRST. The horizontal axis represents the residue numbers and vertical axis the current hydrogen bond energy cutoff in kcal/mol. Flexible regions of the polypeptide chain appear as black thin lines and rigid clusters as colored blocks. Dash line represent the energy cutoff associated with start of allosteric transmission and long dash line represents the end of allosteric transmission (as shown in C). As hydrogen bonds cutoff is decreased, rigid clusters break up and other parts of the chain become flexible. (B) Rigid clusters mapped onto 3D protein structure at -0.5 kcal/mol. (C) The transmission of conformational degrees of freedom (DOF) from region 112–116 and 140–147 (shown in blue) to region 41–70 (shown in red) (i.e., a change in rigidity at site one propagating to modify rigidity at site two) as a function of energy cutoff. Positive DOF transmission demonstrates the presence of allosteric transmission between the two regions.
