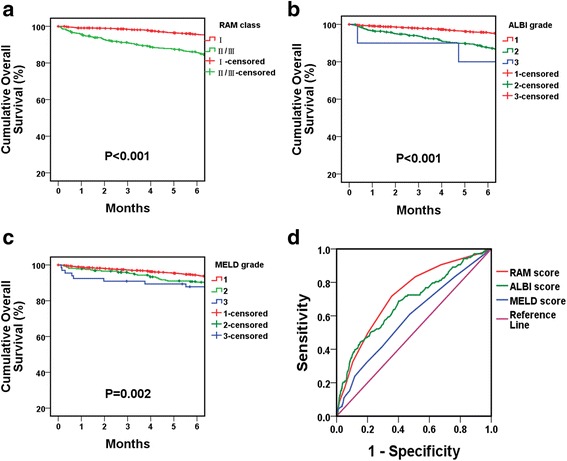
Fig. 1.

Kaplan–Meier survival curves and ROC curves for early mortality. a, b and c Six-month Kaplan–Meier survival curves according to RAM, ALBI and MELD classifications (all P < 0.001). d ROC curves of RAM, ALBI and MELD scores for predicting early mortality (AUC =0.723, 0.682, and 0.590, respectively; RAM vs. ALBI, P = 0.121, RAM vs. MELD, P = <0.001). For RAM score, when cutoff score was 4.5, the sensitivity and specificity for 6-month mortality was 0.717 and 0.644, respectively. For ALBI score, when cutoff score was −2.425, the sensitivity and specificity for 6-month mortality was 0.442 and 0.848, respectively. For MELD score, when cutoff score was 7.5, the sensitivity and specificity for 6-month mortality was 0.609 and 0.528, respectively
