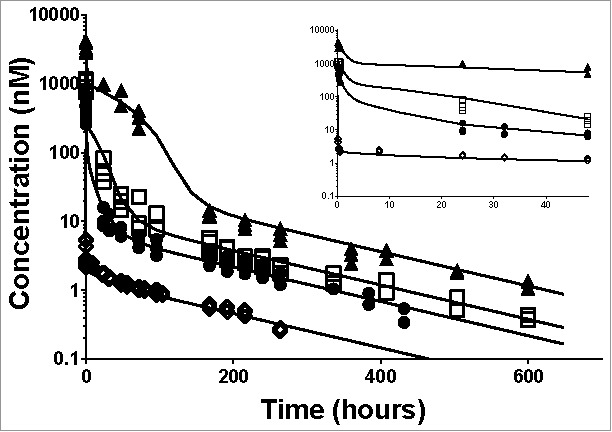
Figure 2.

Individual plasma total anti-ASGPR antibody concentrations over time and model prediction in mice after IV bolus dosing. Markers present individual measurements for 1 mg/kg (◊), 5 mg/kg (•), 10 mg/kg (□) and 30 mg/kg (▴). Lines represent the developed model predicted values for the tested doses. The inset represents a detailed zoom-in of the data and predictions from 0 to 48 hours. The model parameters used for simulations are presented in Table 1.
