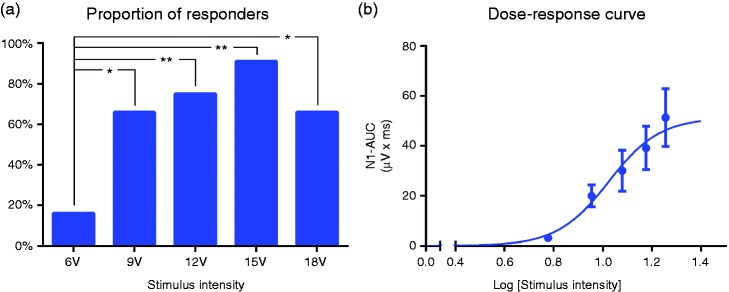
Figure 3.
(a) Proportion of participants who had an identifiable response (at least unilaterally) using each preprogramed stimulation intensity (chi-square analysis considering all intensities); (b) logarithmic dose-response curve.
AUC: area under the curve.
*p < 0.05; **p < 0.01.
A responder was defined as a participant who demonstrated at least one measurable electrophysiological signal (after left or right stimulation at any intensity) that was easily distinguishable from the baseline noise.

