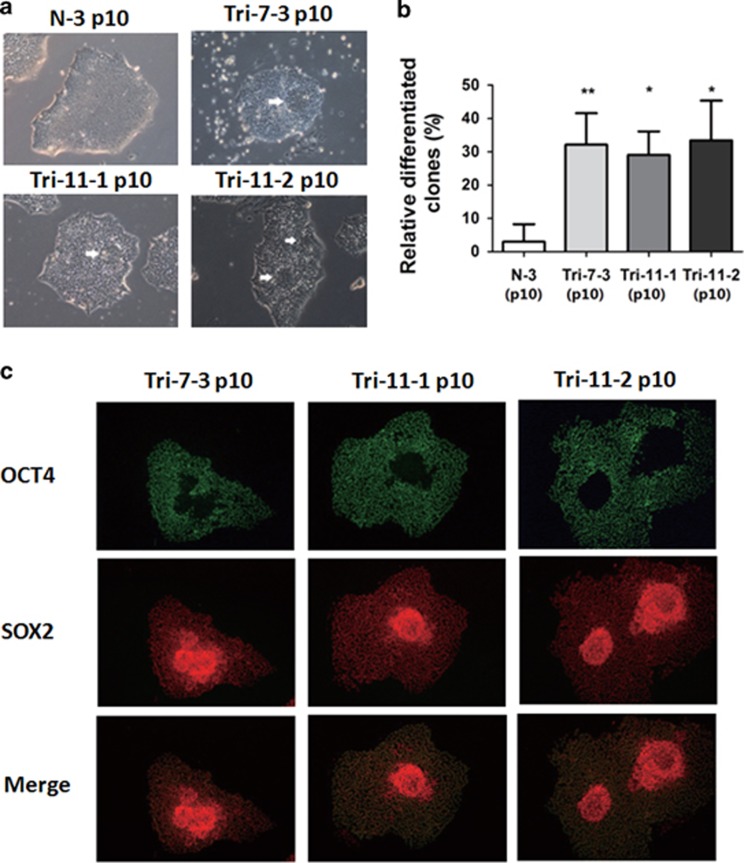
Figure 4.
Increased spontaneous differentiation in 18T-iPSCs. (a) Phase contrast of the differentiated colonies from each of the three 18T-iPSC lines and the control iPSC line. Differentiated areas are indicated by white arrows. Bar, 200 μm. (b) Percentage of differentiated colonies in each cell lines were calculated. N-3 iPSCs were used as a control. Experiments were repeated for three times. Error bars represent S.D., and P-values were determined by the Student’s t-test. *P<0.05, **P<0.01. (c) Immunostaining images showed that cells lacking expression of OCT4 (green) in the differentiated areas expressed only SOX2 (red). Bar, 200 μm. N-3: normal iPSCs derived from healthy AFC; Trisomy 18 iPSCs cell line: Tri-7-3, Tri-11-1, and Tri-11-2

