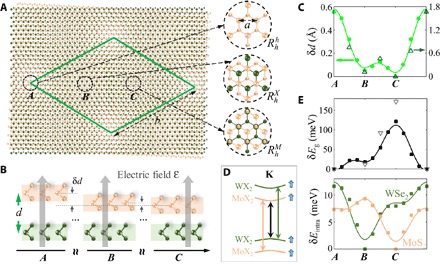
Fig. 1. Moiré modulated local energy gaps and topographic height in the heterobilayer.

(A) Long-period moiré pattern in an MoX2/WX2 heterobilayer. Green diamond is a supercell. Insets are close-ups of three locals, where atomic registries resemble lattice-matched bilayers of different R-type stacking. (B and C) Dependence of interlayer distance d on the atomic registries. In (C), dots are our first-principles calculations for the MoS2/WSe2 heterobilayer, and triangles are the scanning tunneling microscopy (STM) measured variation of the local d values in a b = 8.7 nm MoS2/WSe2 moiré in the study of Zhang et al. (26). The variation in d then leads to laterally modulated interlayer bias (∝ d) in a uniform perpendicular electric field, as (B) illustrates. (D) Schematic of relevant heterobilayer bands at the K valley, predominantly localized in either the MoX2 or WX2 layer. (E) Top: Variation of the local bandgap Eg [black arrow in (D)] in the MoS2/WSe2 moiré. Bottom: Variation of the local intralayer gaps [denoted by arrows of the same color in (D)]. In (C) and (E), the horizontal axis corresponds to the long diagonal of the moiré supercell, and the vertical axis plots the differences of the quantities from their minimal values. The curves are fitting of the data points using eqs. S2 and S3 in section S1.
