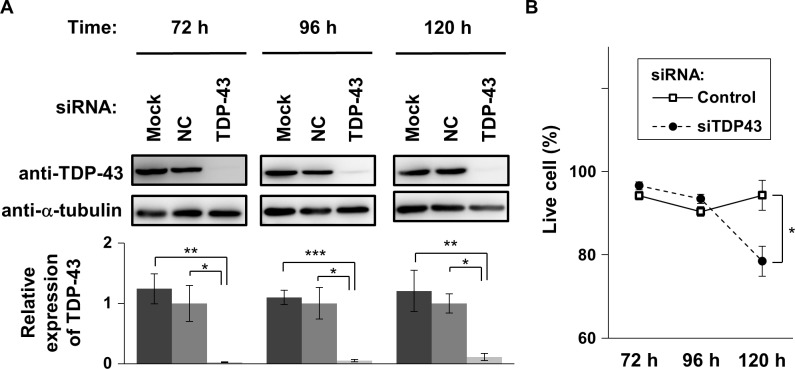
Fig 1. Time course of cell death during TDP-43 depletion.
(A) Western blot analysis of endogenous protein expression of TDP-43 and α-tubulin during siRNA-mediated TDP-43 knockdown. Time after transfection of T43-siRNA, NC-siRNA (NC), or no siRNA and transfection reagents (Mock) is indicated (72, 96, and 120 h). α-tubulin was used to normalize band intensities of TDP-43. Bars in bottom graphs indicate the normalized amount of endogenous TDP-43 (mean ± SEM; n = 3). Significance between indicated pairs was tested by Student’s t test: *p < 0.05, **p < 0.01, and ***p < 0.001. (B) The proportion of live cells at 72, 96, and 120 h after transfection of T43-siRNA and NC-siRNA as a negative control (circle and square, respectively; mean ± SEM; n = 3). Significance between T43-siRNA- and NC-siRNA-transfected cells was tested by Student’s t test: *p < 0.05.

