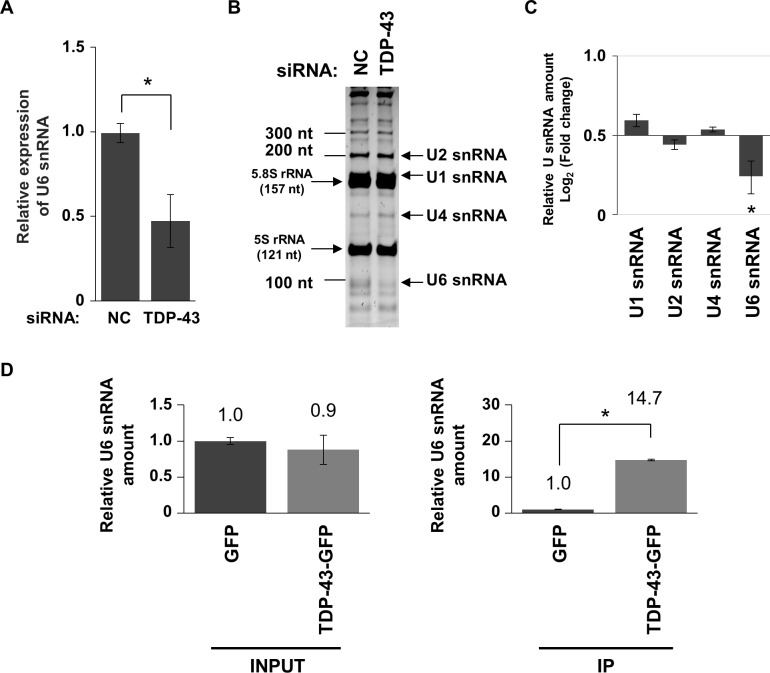
Fig 2. Downregulation of U6 snRNA in TDP-43-knocked down Neuro2A cells.
(A–C) Quantification of the expression change of small RNAs during TDP-43 knockdown. Significance was tested by Student’s t test: *p < 0.05. (A) Relative expression of U6 snRNA in T43-siRNA-transfected cells compared with that in NC-siRNA-transfected cells. The expression level of 18S rRNA was used as an internal control (mean ± SEM, n = 3). (B) Gel image of Urea-PAGE. Left bar indicates molecular size in nucleotides (nt) of marker. The two dominant bands correspond to 5.8S and 5S ribosomal RNA (rRNA). (C) Relative amount of U1, U2, U4, and U6 snRNAs in T43-siRNA-transfected cells compared with that in NC-siRNA-transfected cells (mean ± SEM, n = 3). (D) Quantification of the binding of U6 snRNA to TDP-43 by CLIP. The amount of U6 snRNA in the sample containing TDP-43-GFP was normalized against that in the sample containing GFP as a negative control in each input cell lysate (INPUT) or immunoprecipitated mixture (IP) (mean ± SEM; n = 3). Significance indicated in the graph was tested by Student’s t test: *p < 0.05.

