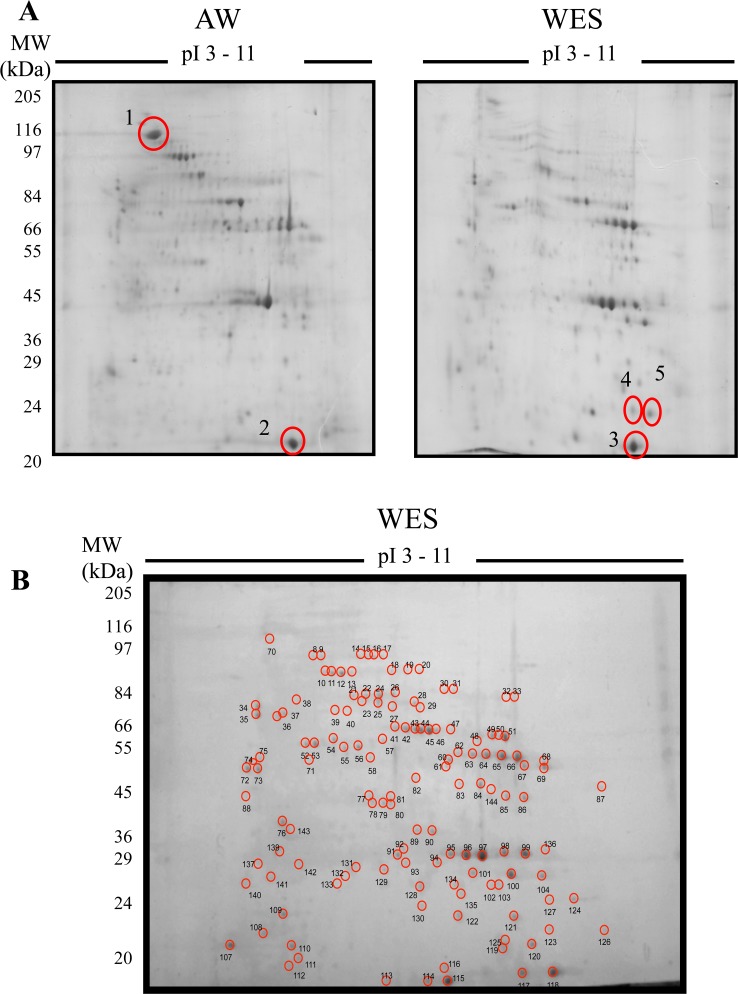
Fig 1. Proteomic analysis of WES molecules.
(A) Comparative 2D proteomic analysis between adult male worm somatic molecules (AW) and WES molecules. AW and WES (200 μg) were electrofused in a 3–11 IPG strip and then electrophoresed in a 12% SDS-PAGE stained with colloidal-coomassie blue. Five spots (circled and numbered 1–5) were selected for identification by mass spectrometry. Protein hits: 1 –SmParamyosin (Smp_021920.1); 2–3 –SmFatty acid-binding protein (Smp_095360.1); 4–5 –SmCyclophilin (Smp_040130). (B) A representative gel of S. mansoni WES molecules, analysed as in (A), showing individual spots that were analyzed by mass spectrometry.

