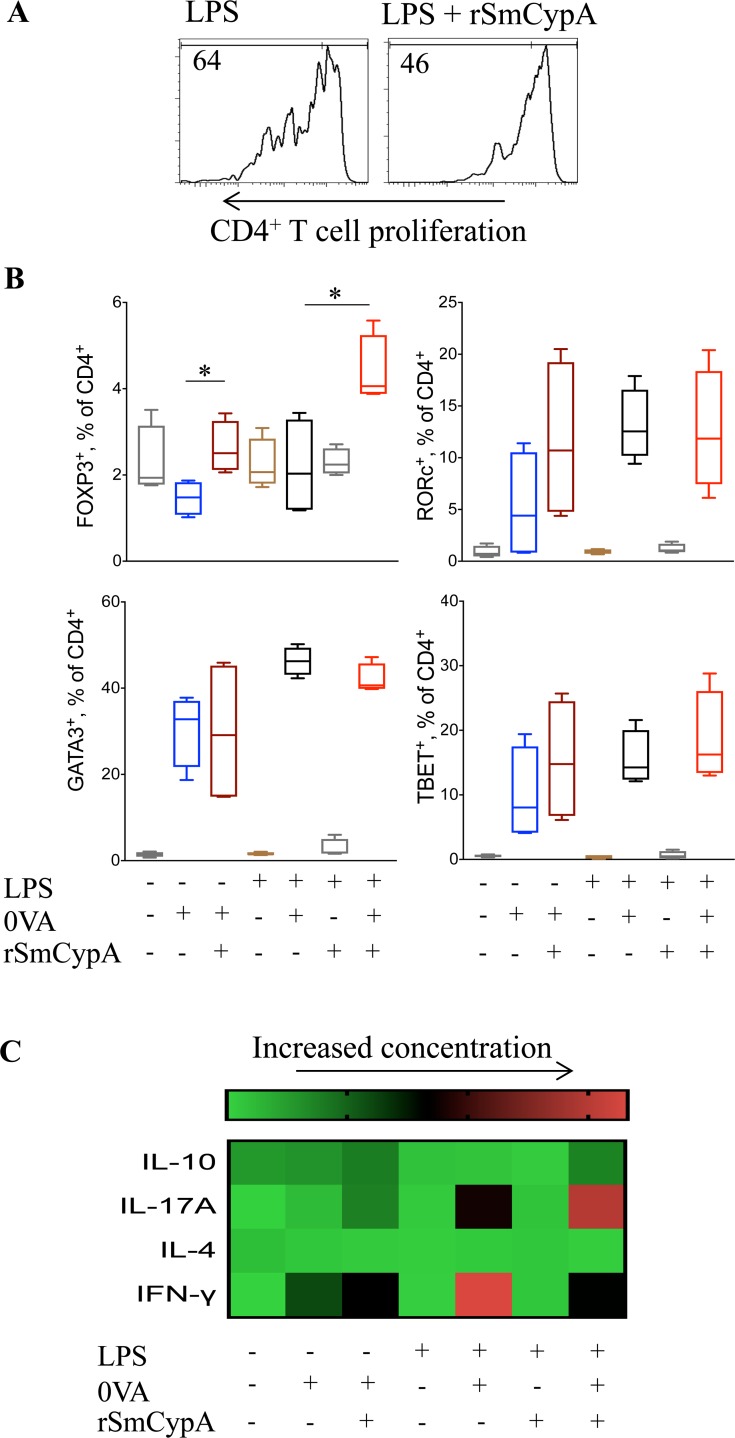
Fig 4. Modulation of CD4+ T cells by SmCypA-treated BMDC.
(A) Representative histograms from flow cytometric analysis of CFSE labeled TCROVA CD4+ T cell cultures with OVA and LPS treated or LPS and rSmCypA co-treated BMDC as APC. (B) Flow cytometric analysis for the identification of Treg (FOXP3+), Th17 (RORc+), Th2 (GATA3+) and Th1 (TBET+) CD4+ T cells following culture with OVA and BMDC as APC, activated under the outlined conditions, n = 4 per group. (C) Heatmap of ELISA for the detection of IL-10, IL-17A, IFN-γ and IL-4 in the supernatant of TCROVA CD4+ T cells and BMDC co-cultures. BMDC were activated, or not, under the indicated conditions prior to their co-culture with the TCROVA CD4+ T cells ± antigen (OVA), n = 6 per group. Data are presented as mean and SEM and statistical difference between groups was determined using Student's t test.

