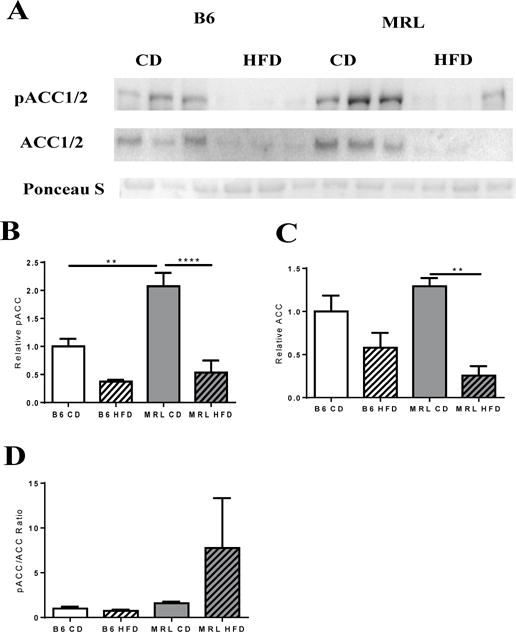
Figure 2.

(A) Western blot analysis of ACC and pACC, key metabolic enzymes in lipid metabolism, were assessed. (B) Densitometry analysis of pACC (normalized against total protein content- Ponceau S). Bar graph of relative pACC expression in the different groups shows increased basal oxidation in MRL when compared with B6 mice, with a significant decrease in expression after a HFD in MRL mice. (C) Bar graph of normalized ACC expression shows a significant decrease in ACC expression after the diet intervention period. (D) pACC/ACC ratios relative to each group. n= 3 B6; n=5, MRL; ** p<0.01, **** p<0.0001. Acetyl-CoA carboxylase (ACC), phosphorylated ACC (pACC).
