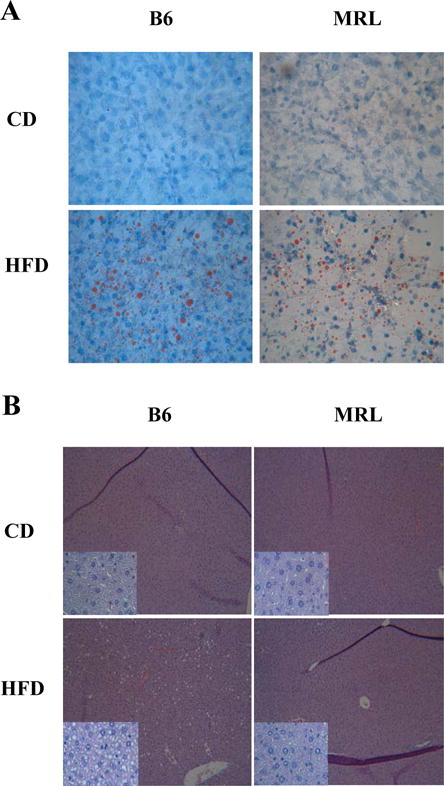
Figure 4.

Representative images of ectopic fat in the liver in each mouse group. While B6 show the characteristic ectopic lipid accumulation in the liver after a prolonged high-fat diet protocol period, MRL HFD-fed mice show decreased lipid accumulated in the liver when compared to B6 HFD control. (A) Oil Red O histology staining of each mouse group. Neutral lipid droplets are seen in red. Upper panels show representative image of control-fed B6 and MRL mice. Lower panels show representative image of HFD B6 and MRL mice. 40× magnification (B) Hematoxylin and eosin staining of liver slides shows lipid-like structures distributed across the B6 HFD mice liver cells but not in either CD-fed mouse strains nor in the MRL HFD-fed mice. 10× magnification, insets: 40× magnification.
