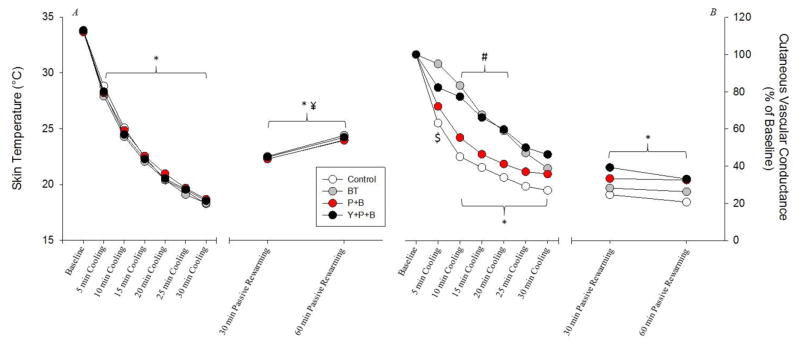
Figure 1. Tskin and %CVC Responses throughout Skin Surface Cooling and Passive Rewarming.
The Tskin response is illustrated in panel A whereas the %CVC response is illustrated in panel B. Clear circles represent the control condition, grey circles represent the BT condition, red circles represent the P+B condition, while black circles represent the Y+P+B condition. All data presented as means ± SD. *: P<0.001 for each condition relative to pre-cooling baseline. ¥: P<0.001 for each condition relative to 30-min of cooling. #: P<0.001 for magnitude of constriction in Control & P+B sites relative to BT & Y+P+B sites. $: P<0.01 for Control, P+B, and Y+P+B sites relative to pre-cooling baseline. For clarity purposes error bars have been removed from both panels.

