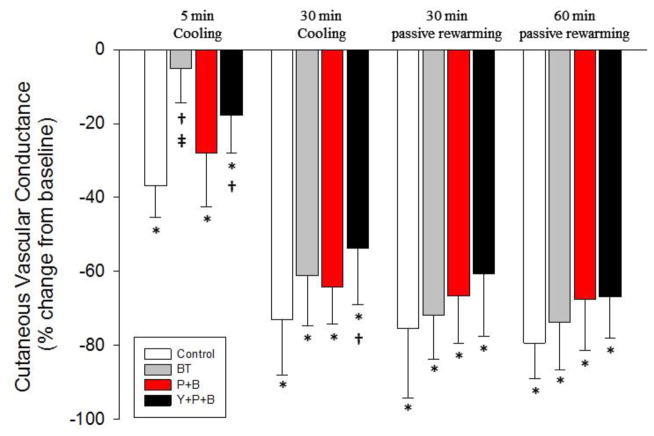
Figure 2. %CVC Responses throughout Skin Surface Cooling and Passive Rewarming.
Clear bars represent the control condition, grey bars represent the BT condition, red bars represent the P+B condition, while the black bars represent the Y+P+B condition. All data presented as means ± SD. *: P<0.001 for each condition relative to pre-cooling baseline. †: P<0.01 relative to the control site. ‡ P<0.01 relative to the P+B site.

