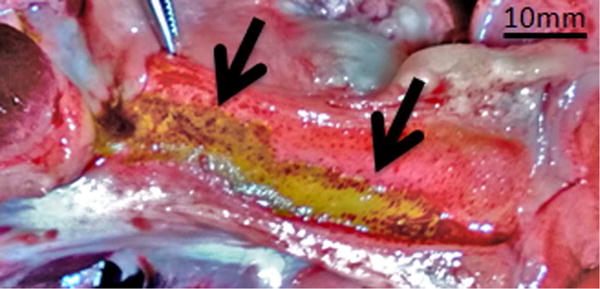
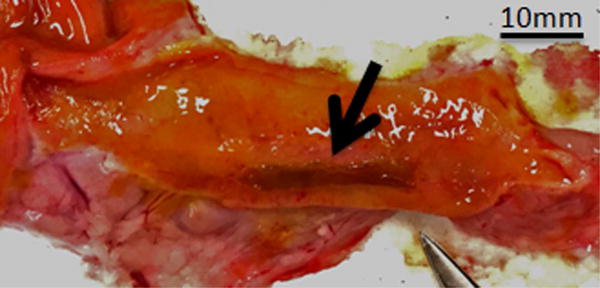
Figure 3.


Gross appearance of the bile duct mucosa after treatment with IRE. A, Specimen from animal killed 1 day after treatment. Two distinct locations of treatment can be observed (arrows). Mucosa of the treated regions has a yellow tinge and is surrounded with brown/reddish region. B, Specimen from animal killed 7 days after treatment. Mucosa at the site of treatment appears dark brown (arrow) when compared with surrounding normal bile duct.
