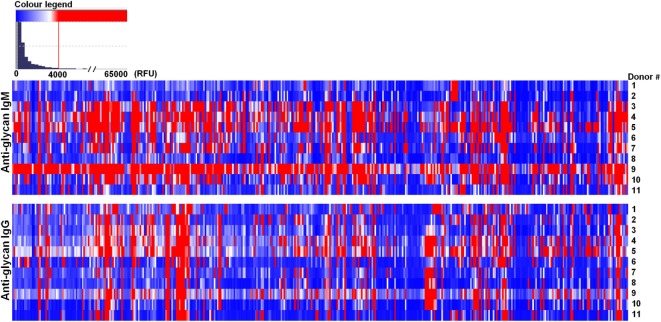
Figure 2.
Humans showed different repertoire of natural circulating anti-carbohydrate antibodies. Human (n = 11) serum (1:15) was incubated with chips printed with 419 glycans. Chips were scanned using a ScanArray GX Plus reader and data were analyzed with the ScanArray® Express Microarray Analysis System (PerkinElmer). The binding results for IgM and IgG were expressed in relative fluorescence units (RFU) as median ± median absolute deviation (MAD). In the heat map blue and white colors represent binding signals, in RFU, lower than 4,000 (background); red color signals ≥4,000 RFU (positive binding).

