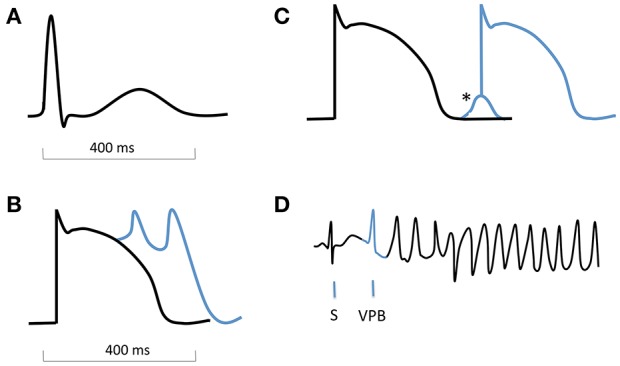
Figure 2.

Schematic ECG, action potentials with afterdepolarizations, and onset of torsade de pointes. (A) normal QRS complex and T wave on an ECG. (B) action potential with early afterdepolarizations (EADs). (C) action potential with delayed afterdepolarization (DAD, *). (D) ECG showing onset of TdP, with a sinus beat (S) followed by a ventricular premature beat (VPB, blue) which is triggered by an EAD.
