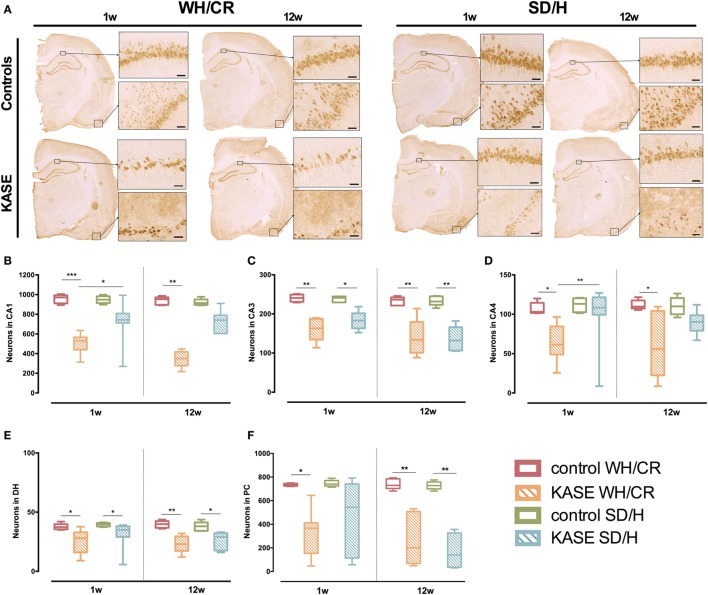
Figure 4.
Neuronal loss in KASE WH/CR and KASE SD/H rats. (A) Representative KASE and control rats 1 and 12 weeks post-status epilepticus (SE). At both time points, a significant difference could be demonstrated for the investigated regions (B–F) between the respective control and KASE WH/CR animals, while for the SD/H animals only in CA3 and DH 1 week post-SE, and CA3, DH, and PC 12 weeks post-SE (C,E,F). In addition, for the CA1 and CA4 sub-regions, significant higher neuronal loss could be demonstrated for the KASE WH/CR animals compared to KASE SD/H rats 1 week post-SE. Kruskal–Wallis test with post hoc Dunn’s test (B–F). 1 week post-SE: control WH/CR n = 5, KASE WH/CR n = 10, control SD/H n = 5 and KASE SD/H n = 9; 12 weeks post-SE: control WH/CR n = 7, KASE WH/CR n = 6, control SD/H n = 6 and KASE SD/H n = 6. Insets were taken at 10× magnification. Scale bar = 50 µm. *p < 0.05, **p < 0.01. WH/CR, Wistar Han/Charles River; SD/H, Sprague-Dawley/Harlan; w, week; CA, cornu ammonis; DH, dentate hilus; PC, piriform cortex; KASE, kainic acid-induced status epilepticus.

