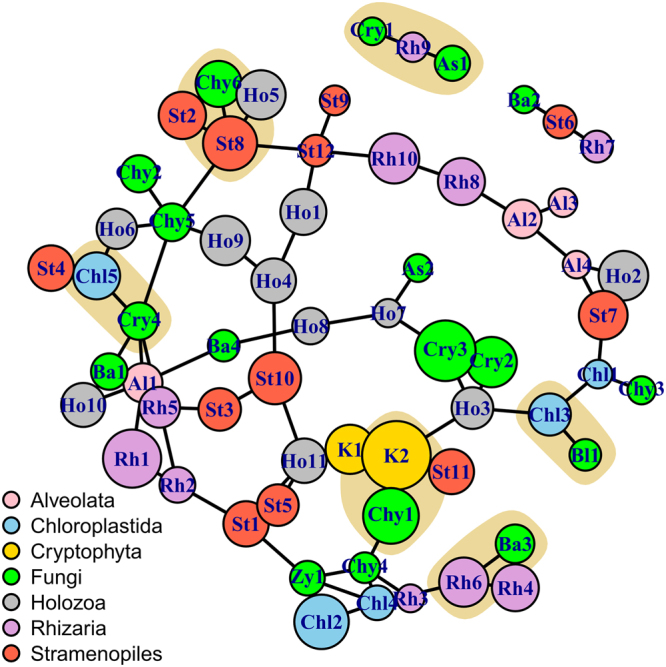
Figure 6.

Network analysis highlighting the relationships within the fungal taxa and between fungi with respect to other eukaryotes cohabiting the lake basins. Colors of the nodes represent the taxa and the beige clouds highlight intergroup relationships, while the size of the circles is proportional to their log-abundance. Node names are composed of the initials of the taxonomic group and the consecutive number. We used SpiecEasi to generate the network of the 62 most abundant eukaryotic genera (comprising 98.2% sequences), which was then visualized with igraph. As:Ascomycota, Ba:Basidiomycota, Ba3:Glaciozyma, Bl:Blastocladiomycota, Chl2:Chlorophyta, Chl3:Choricystis, Chl4:Paratrimastix, Chl5:Prasinophytae, Chy:Chytridiomycota, Chy1:Chytridiaceae, Chy6:Rhizopidiales, Cry:Cryptomycota, Cry4:LKM15, K2:Geminigera, Rh6:Heteromyta, St8:Parahysomonas, Zy:Zygomycota, Zy1:Harpellales. The taxonomic description of the remaining nodes is shown in Supplementary Table S2.
