Figure 5.
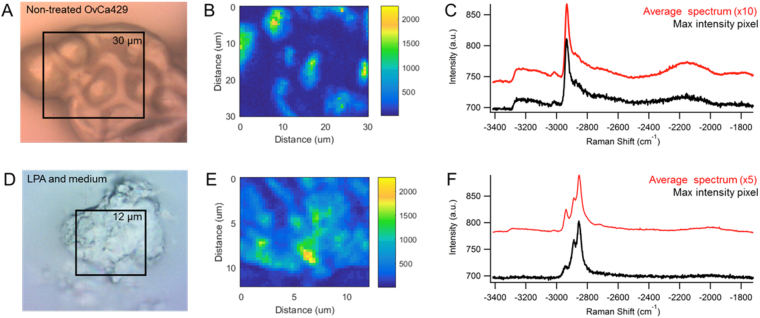
(A) Brightfield image of non-treated OvCa429 MCA with (B) CARS image of −2930 cm−1 has high CH3 signal displayed in the (C) the maximum intensity pixel and average spectrum. Experimental parameters: Pump = 720 nm, 22.50 mW; Supercontinuum = 785–945 nm, 5.05 mW; Acquisition time = 500 ms/pixel; Map size = 51 × 51 pixels; Steps = 600 nm; Objective = 40x, 0.75NA. (D) Brightfield image of crystallized LPA in conditioned medium correlates well with the (E) CARS image of −2850 cm−1 peak area. (F) The CARS spectra from the maximum intensity pixel and map average show three peaks at −2850, −2880, and −2930 cm−1 from a combination of symmetric CH2, asymmetric CH2, and CH3 stretches, respectively. Experimental parameters: Pump = 720 nm, 25.20 mW; Supercontinuum = 785–945 nm, 3.80 mW; Acquisition time = 500 ms/pixel; Map size = 41 × 41 pixels; Steps = 300 nm; Objective = 100x, 0.9 NA.

