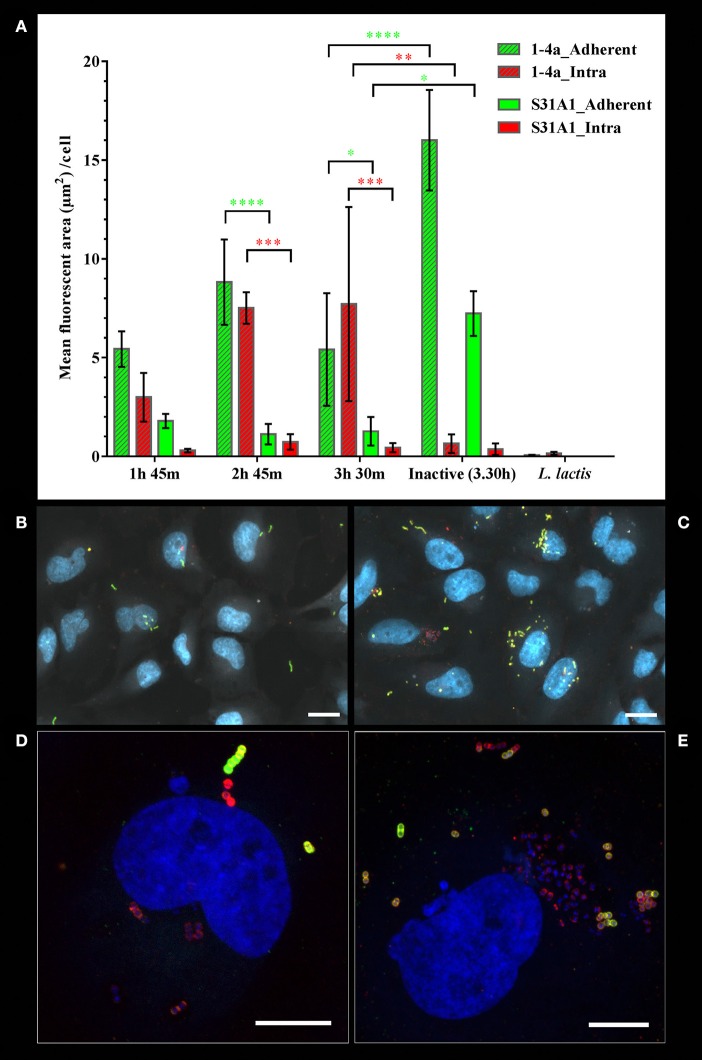
Figure 4.
Adherent and intracellular S. zooepidemicus determined by double immunofluorescence staining and quantitative analysis of fluorescent intensities. The S. zooepidemicus strains were co-cultured with HeLa cells. The infection was stopped at various time points (1 h 45 m, 2 h 45 m, and 3 h 30 m) immunofluorescence stained and analyzed as described in Materials and Methods. (A) The graph shows bacterial fluorescent cell area per HeLa cell, were the extracellular/adherent signals are shown with green bars and the intracellular signals shown with red bars. Strain 1-4a bars are slashed, while strain S31A1 bars have no filling. Means ± SD from three independent experiments are shown. Green asterisks mark significant difference between extracellular/adherent bacterial signals, and red asterisk mark significant difference between intracellular bacterial signals. *p < 0.05, **p < 0.01, ***p < 0.001, ****p < 0.0001. (B) Overview image showing adherent (green and yellow) and intracellular (red) bacteria for strain S31A1. (C) Overview image showing adherent and intracellular bacteria for strain 1-4a. For (B) and (C) autofluorescence, demarking the HeLa cells, is shown in white, and for (B–E) DNA is shown in blue. (D) Maxprojection of a confocal stack showing a strain S31A1 infected cell (E) Maxprojection of a confocal stack showing a cell highly infected with strain 1-4a. (B,C) Axioscan images, scale bars are 20 μm. (D,E) confocal images, scale bars are 10 μm.

