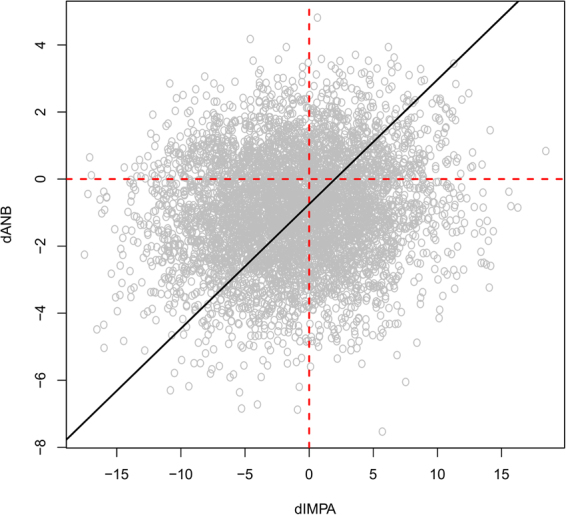
Figure 5.

Values simulated from the Bayesian network for and . The black line represents the regression line of against ; its positive slope suggests that is proportional to , so a decrease in one suggests a decrease in the other.

Values simulated from the Bayesian network for and . The black line represents the regression line of against ; its positive slope suggests that is proportional to , so a decrease in one suggests a decrease in the other.