Figure 1.
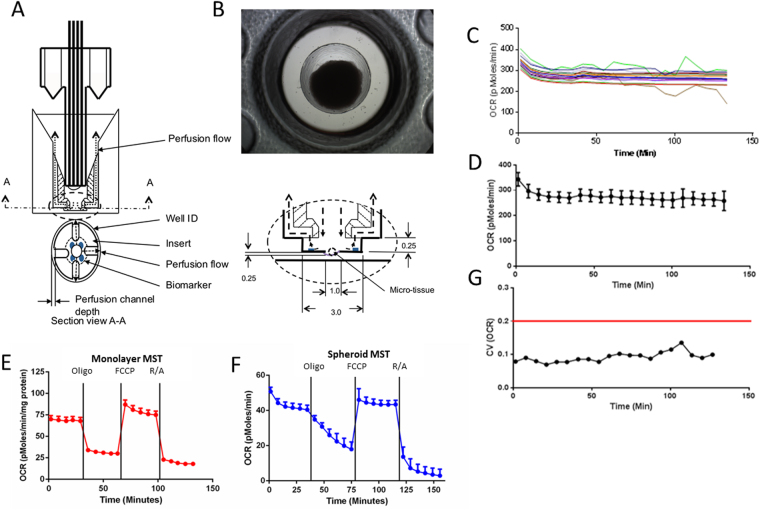
Metabolic Profiling of 2D vs. 3D cell culture model. (1A) Schematic of the microtissue perfusion insert placed in each well of a seahorse flux pack to enable localization of a spheroid during metabolic profiling. (B) Representative image (4X magnification) of an HCT116 spheroid within a microtissue perfusion insert. Average diameter 829.332 ± 27.13 µM. (C) OCR of HCT116 spheroids over time plotted individually (n = 16). (D) Oxygen Consumption Rate (OCR) of the spheroids as a group, OCR is maintained over a period of 140 mins. (E) Mitochondrial stress test in an HCT116 colorectal cancer 2D monolayer 12.5k cells per well, undertaken using Seahorse XFe96 Extracellular Flux Analyzer. Oligomycin (1 uM), FCCP(1 uM) and Rotenone/Antimycin A(1 uM) used to test mitochondrial metabolism. (F) Mitochondrial stress test in an HCT116 colorectal cancer 3D spheroid model. G: Coefficient of variation <20% within the spheroid OCR values observed. Error bars represent + -SEM.

