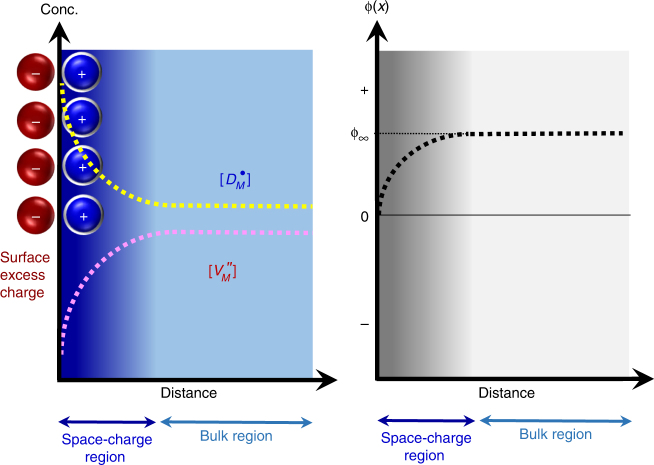
Fig. 1.
Distribution of charged defects and electrical potential near the surface. This figure shows the case of donor doping in a MO-type oxide crystal. and in the left diagram indicate the concentrations of donors and cation vacancies in the Kröger–Vink notation, respectively. The ϕ∞ in the right diagram also denotes the electrical potential in the bulk far from the surface. Strong segregation of donors and corresponding deficiency of cation vacancies in the space-charge layer is noted to compensate the excess surface charge. For more details, see Supplementary Note 1 and Supplementary Fig. 1

