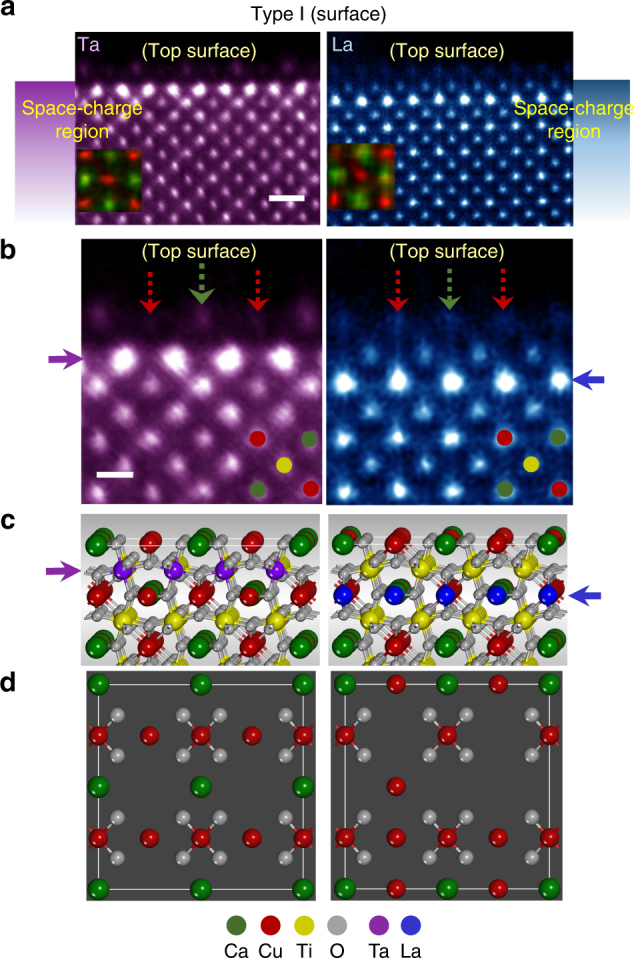
Fig. 3.

Structures of Type-I {100} interfaces (free surface). a HAADF images from Ta- and La-doped samples are provided. The insets superimposed on the images are atomic-scale composition maps discriminating the ordered array between Ca (green) and Cu (red) in the A sites. Scale bar, 5 Å. b The enlargements are given to compare the different positions of a segregation layer, as denoted by purple and blue arrows, respectively. However, the top surface is noted to identically consist of Ca- and Cu-column termination in both cases, as indicated by green and red arrows. Scale bar, 2.5 Å. c, d Each set of illustrations describes the plausible atomic structure in the cross-sectional view in (c) and in the (100) plane view in (d)
