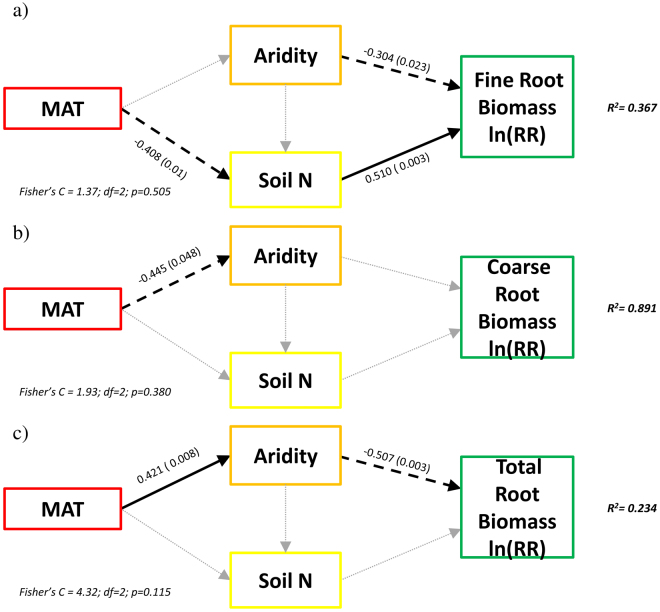
Figure 4.
Effects of MAT, Aridity and soil N content on: (a) fine root biomass, (b) coarse root biomass and (c) total root biomass response to eCO2. Numbers adjacent to the arrows indicate the effect size of the relationship, while the p-values are shown in brackets. Continuous and dashed black arrows indicate positive and negative relationships, respectively, while grey arrows indicate non-significant relationships. R2 denotes the proportion of the model variance explained. Overall goodness-of-fit test is shown in the bottom of each figure. Aridity was calculated as [AI in this dataset – AI in each site] so increases in aridity represent places with low water availability.

