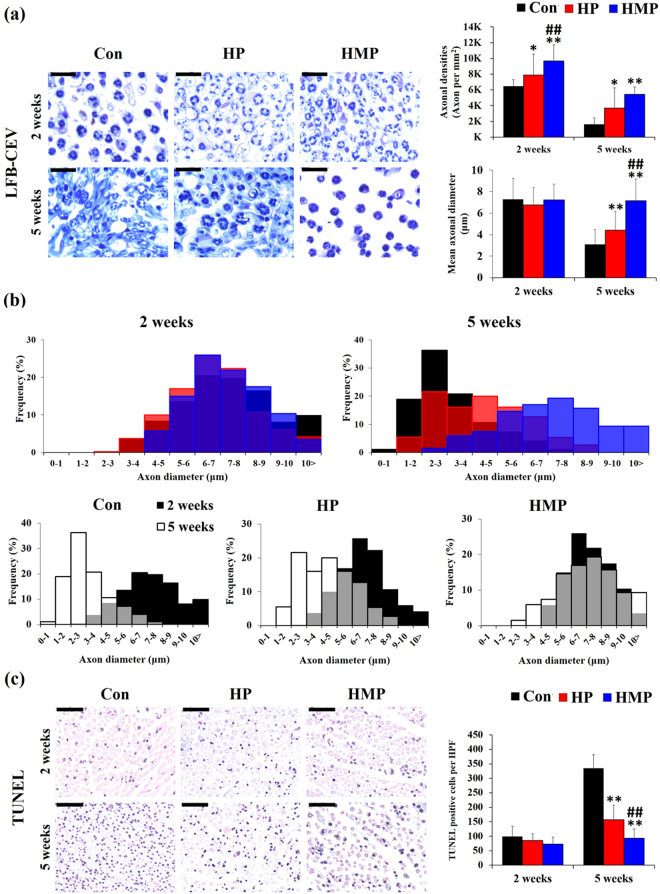
Figure 4.
LFB-CEV and TUNEL staining of the sciatic nerves in the experimental groups at 2 and 5 weeks post-implantation. (a) Representative images and statistical analysis of Luxol fast blue-cresyl echt violet (LFB-CEV) staining. Scale bar = 20 μm, (b) Axon diameters distribution in the experimental groups (LFB-CEV staining). (c) Representative images and statistical analysis of TUNEL staining. Scale bar = 50 μm. Data were expressed as mean ± SD, three samples for each group and each time point. *Compared to Con; #Compared to HP; *, # p < 0.05, **, ## p < 0.01; One-Way ANOVA analysis.

