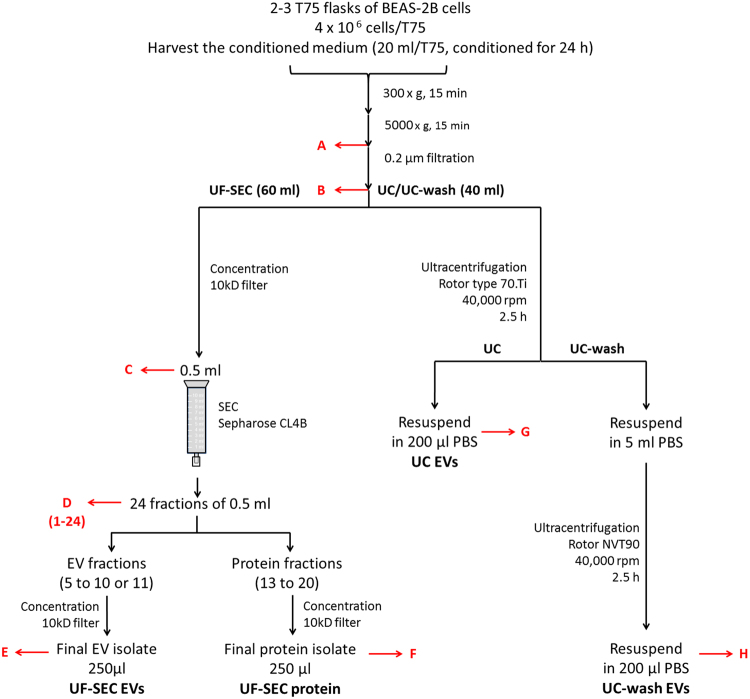
Figure 1.
Flow chart of the EV isolation protocols. Red arrows indicate where samples were taken for determination of EV recovery based on CD63+ CD81+ bead-coupled flow cytometry. For nano LC/MS-MS, the isolation protocols were scaled up to 120 ml of cell culture medium as starting material. For UF-SEC, the 120 ml were concentrated by 10 kDa filtration and subsequently run over the SEC column in two aliquots of 0.5 ml. The EV containing fractions from both SEC runs (fractions 6 to 10 or 11) were then pooled and concentrated by 10 kDa filtration. For UC, the 120 ml were processed in 3 portions of 40 ml, corresponding to the maximal volume of the UC tubes.

