Figure 3.
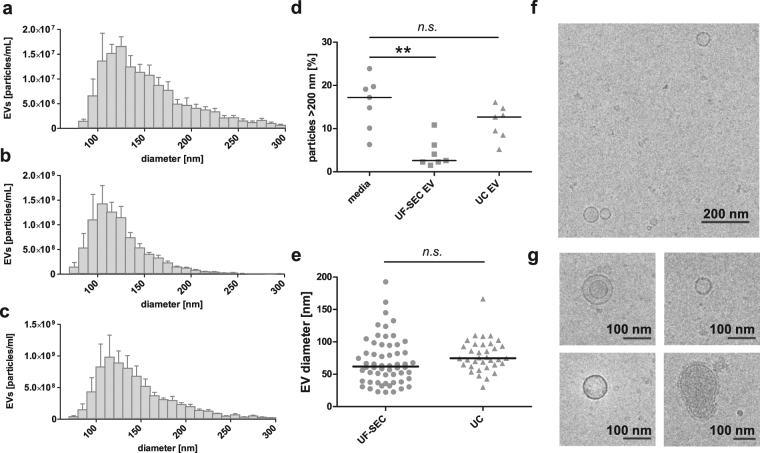
Characterization of EVs in unfiltered conditioned media, UF-SEC EVs and UC EVs. (a) Size distribution histogram of the EVs in (a) unfiltered conditioned media (b) UF-SEC EV isolates and (c) UC EV isolates as determined by TRPS. Graph shows the mean ± SEM, n = 5. (d) The percentage of particles >200 nm in conditioned media, UF-SEC EVs and UC EVs according to TRPS. The bar indicates the median diameter. **p 0.001–0.01 (e) Size distribution of EVs in UF-SEC and UC isolates based on cryo-TEM. The bar indicates the median diameter. (f) Low magnification and (g) detail cryo-TEM recording of UF-SEC isolated EVs from BEAS-2B.

