Fig. 2.
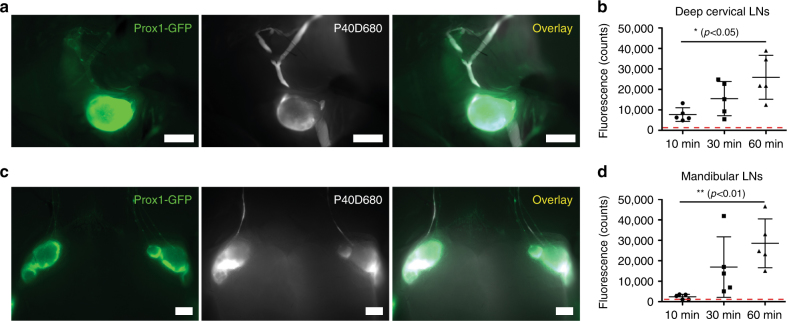
Tracer outflow to draining lymph nodes in the neck. a Representative pictures of tracer within the left deep cervical lymph node and afferent and efferent lymphatic vessels at euthanization at 10 min after P40D680 infusion into the right lateral ventricle of a Prox1-GFP mouse. Scale bars: 1 mm. b Quantification of fluorescent signal of deep cervical lymph nodes at t = 10 min, 30 min, and 60 min after infusion. n = 5 mice each time point. Red dashed line indicates baseline values from uninjected mice. Data are the mean ± SD. *p < 0.05 (one-way ANOVA with the Tukey’s multiple comparison). c Representative pictures of tracer within the mandibular lymph nodes and afferent and efferent lymphatic vessels at euthanization at 30 min after P40D680 infusion into the right lateral ventricle of a Prox1-GFP mouse. Scale bar: 1 mm. d Quantification of fluorescent signal of mandibular lymph nodes at t = 10 min, 30 min, and 60 min after infusion. n = 5 mice each time point. Red dashed line indicates baseline values from uninjected mice. Data are the mean ± SD. **p < 0.01 (one-way ANOVA with the Tukey’s multiple comparison)

