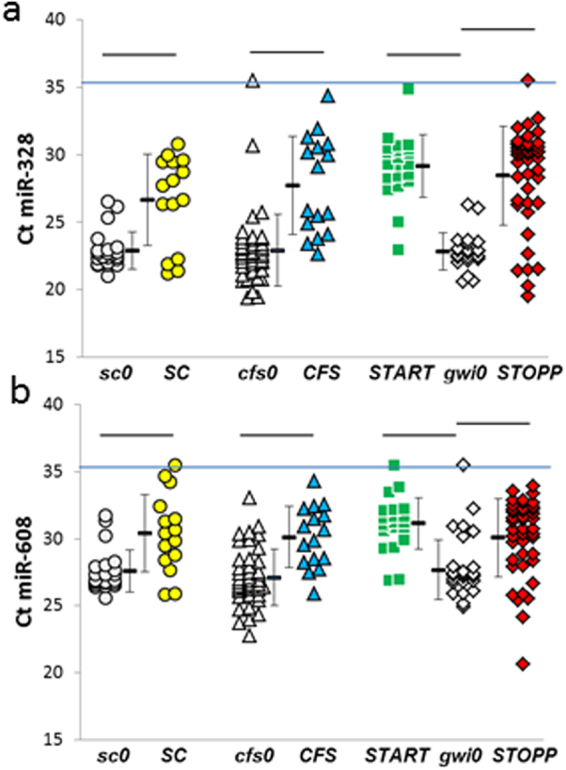
Figure 7.

miRNAs that were significantly elevated in post-exercise compared to appropriate nonexercise control groups. Significant differences between groups were indicated by the bars at the top of the graphs for (a) miR-99b-5p, (b) miR-425-3p, (c) miR-30d-5p, (d) miR-204-5p, and (e) miR-370 (HSD ≤ 0.05, FDR ≤ 0.10, detected with Ct ≤ 35 in more than two thirds of one group per pair). The horizontal blue line indicated Ct = 35. Mean ± SD.
