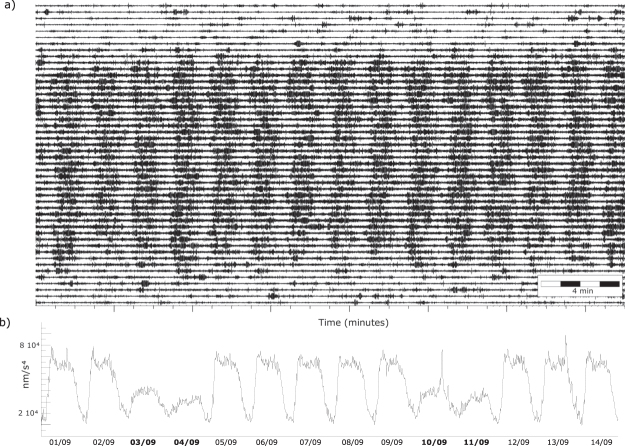
Figure 3.
Seismic signal generated by road traffic. (a) Vertical component of the seismic acceleration band-pass filtered between 8 and 12 Hz. The image shows the complete record for day 09/07/2016, with each line displaying 30 minutes of data. The noise banding reflects the traffic along Av. Diagonal, regulated using a traffic light. (b) Envelope of the vertical component of acceleration, filtered between 8 and 12 Hz and decimated to 1 sample every 10 minutes. Night/day and working day/week-end variations are clearly evidenced. Note the rush hour in working day’s morning and the lower amplitude during Saturdays and Sundays (labeled in bold). Narrow peaks on days 10 and 13 are associated to traffic increase before and after FC Barcelona football games.

