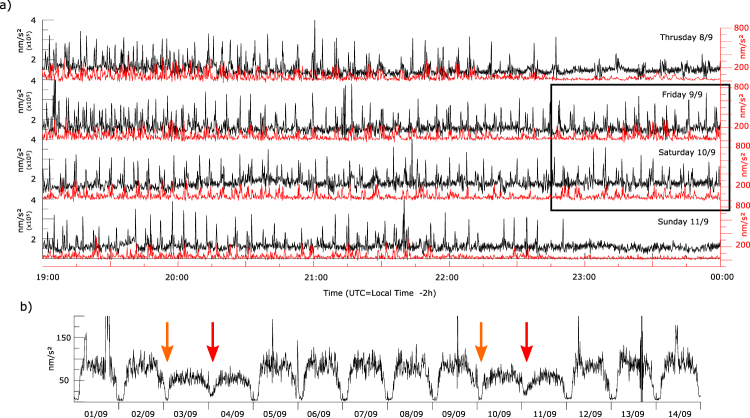
Figure 4.
Seismic signal related to subway activity. (a) Envelope of the vertical acceleration for the interval 19:00–24:00 UTC (21:00–02:00 Local time) from Thursday to Sunday, filtered in the 20–40 Hz (black line) and the 0.008 and 0.05 Hz (red line) bands and decimated to 1 sample every 10 seconds. Late service during Friday and Saturday nights are identified by a box. (b) Envelope of acceleration filtered between 0.008 and 0.05 Hz and decimated to 1 sample every 10 minutes. Friday and Saturday nights are identified with orange and red arrows and clearly differ from the rest of the week. Large peak on day 01/09 correspond to a 7.0 earthquake with epicenter in New Zealand. Other peaks are related to local noise sources.

