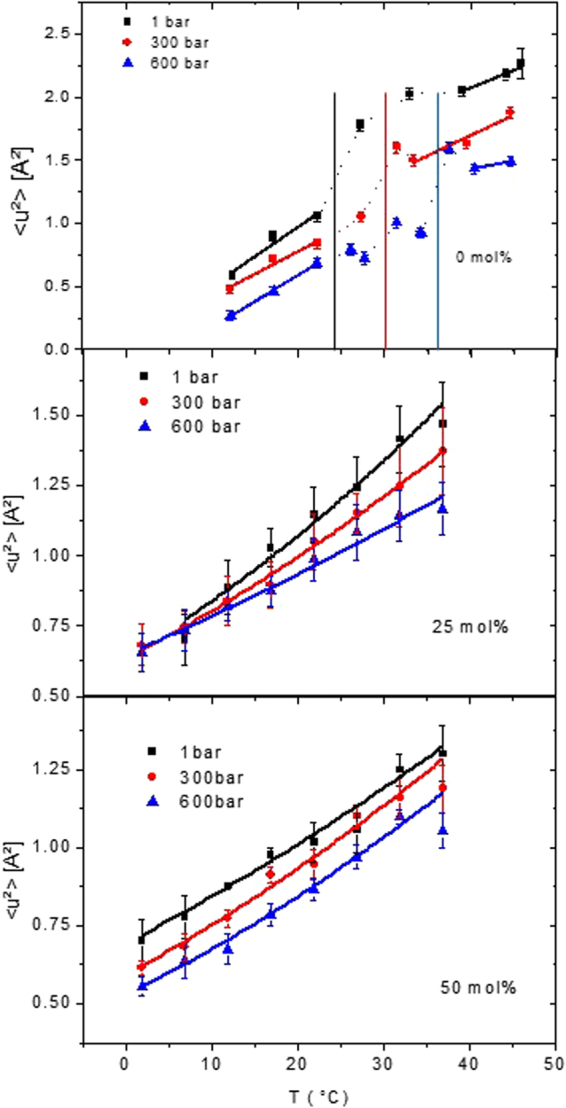
Figure 3.

MSD of pure DMPC (reproduced from ref.31) and both DMPC/cholesterol mixtures calculated according to eq. (17) (without any polydispersity and Cα(τ) = 0). Black squares represent data at atmospheric pressure, red circles correspond to 300 bar and blue triangles to 600 bar. The lines show the fits according to eq. (20) and the effective force constants are calculated with the help of eq. (21). For 0 mol% cholesterol, the dotted lines in the transition region are only guide to the eyes. The vertical lines mark the phase transition temperature at that pressure value.
