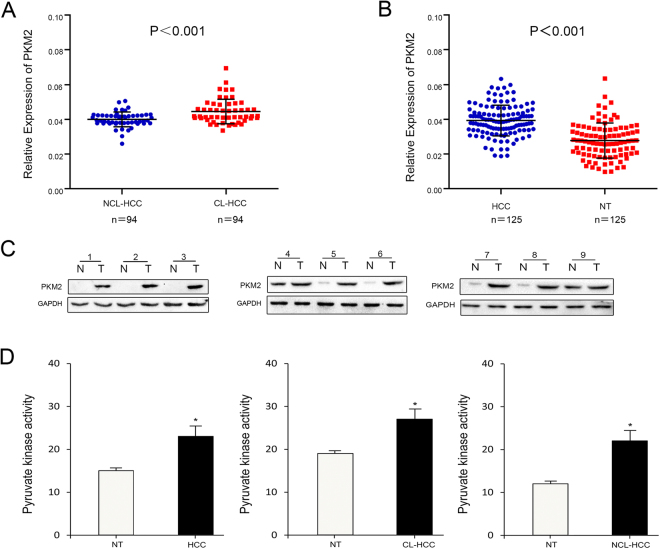
Figure 1.
PKM2 mRNA, protein expression and enzyme activity in HCC. (A) The expression levels of PKM2 were measured with quantitative real-time PCR in 94 NCL-HCC and CL-HCC tissues. (B) The expression levels of PKM2 in the 125 HCC tumour and adjacent non-tumour liver tissues (HCC groups consist of randomly selected NCL-HCC and CL-HCC). (C) Protein levels of PKM2 in 9 representative HCC tissues (T) and adjacent non-tumour liver tissues (N) were analysed by western blotting. The uncropped blots details are provided in Supplementary Fig. S1. The relationship between PKM2 and GAPDH is provided in Supplementary Fig. S2. (D) Pyruvate kinase activity in HCC, CL-HCC and NCL-HCC, *P < 0.05.

