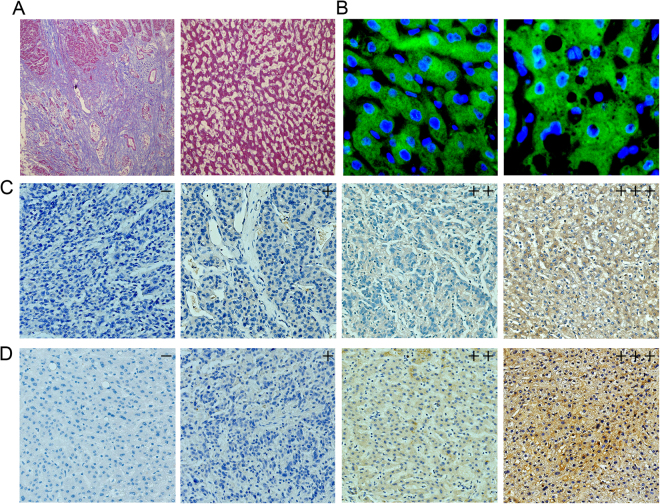
Figure 2.
Masson’s trichrome staining and PKM2 expression in HCC tissue samples. (A) Masson’s staining in CL-HCC and NCL-HCC tissues (from left to right), ×200. (B) The sub-cellular localization of PKM2 in CL-HCC and NCL-HCC tissues (from left to right), ×200. (C) The expression levels of PKM2 in CL-HCC. (−) Negative expression; (+) Weak expression; (++) Moderate expression; (+++) High expression. Original magnification, ×200. (D) The expression levels of PKM2 in NCL-HCC. (−) Negative expression; (+) Weak expression; (++) Moderate expression; (+++) High expression. Original magnification, ×200.

