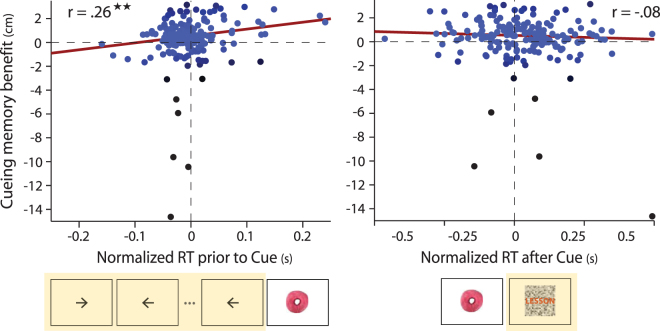
Figure 4.
Cueing memory benefit as a function of ongoing behavior before and after object re-exposure. Data points correspond to the benefit in object-location memory stability for individual cued associations (mean uncued error minus error for each cued association, where error is the distance between object placement from immediate to delayed memory testing). The cueing benefit is shown as a function of mean normalized reaction time (RT) on the arrow task (performed during the ITI) prior to the re-exposure of each association (left panel, time period highlighted in yellow) and the mean normalized RT on the lexical decision task after the re-exposure of each association (right panel, time period highlighted in yellow). Robust regression was used to assess linear relationships between RT and cueing-related memory benefits. Each data point or association is colored based its weight or contribution to the regression model (black data points have a weight close to 0, while blue points have a weight of 1). ★★ P < 0.005.

