Figure 6.
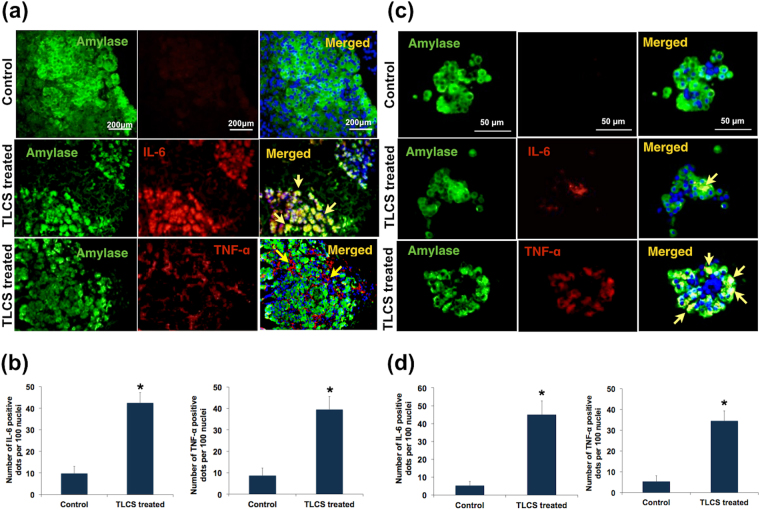
Confirmation of cytokine release by human pancreatic acini in response to exposure to TLCS. (a,c) Representative immunofluorescence (IF) images [scale bar 200 μ] indicating IL-6 and TNF-α after treatment with 500 μM TLCS for 3 hrs (a) from experiments using acinar tissue while (c) from experiments using isolated acini. Green fluorescence in the panels indicates amylase, while red fluorescence indicates IL-6 and TNF-α in the panels of second and third rows respectively. Yellow fluorescence in the merged images in the second row indicates co-localization of IL-6 with amylase implying the location of IL-6 within the acini. Linear red fluorescence around the basolateral surface of the acinar cells in the merged image of the third row indicates localization of TNF-α along the basolateral surface of acinar cells. (b) Histograms showing the quantitative representation of IL-6 and TNF-α positivity respectively, which was significantly higher than that of controls (p = 0.017 and 0.018 respectively) in acinar tissue. (d) Histograms showing the quantitative representation of IL-6 and TNF-α positivity respectively, which was significantly higher than that of controls (p = 0.004 and 0.003 respectively) in isolated acini. Histograms and error bars in (b) and (d) indicate mean standard error of mean (SEM) respectively.

