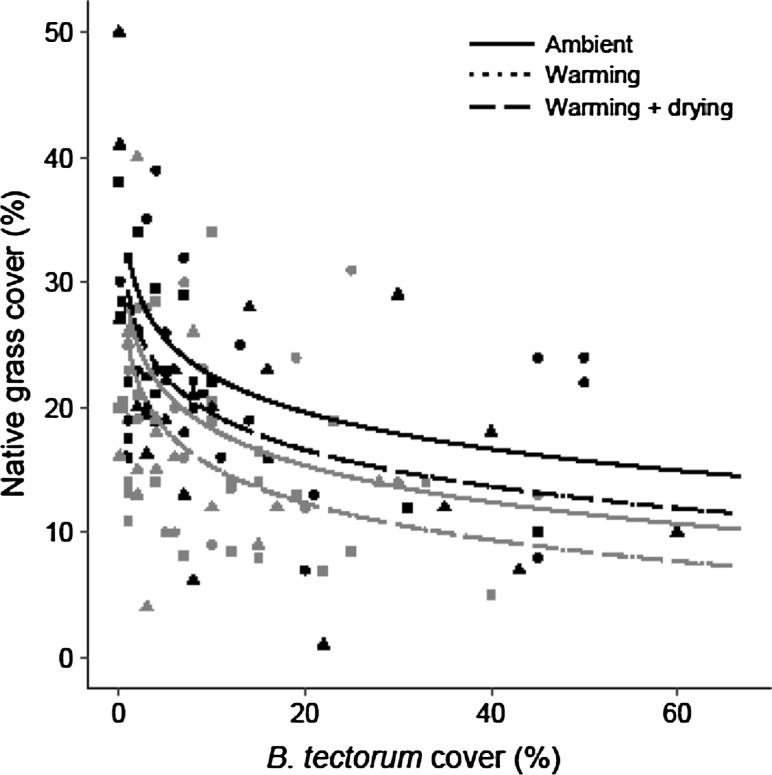
Fig. 4.
Native grass cover in the ambient (circles, solid line), warming (triangles, dotted line), and warming + drying (squares, dashed line) climate treatment plots (0.75 m2) for unburned (black) and burned (gray) fire treatments. Results of a linear mixed-effects model demonstrated that native grass cover was lower in the presence of B. tectorum (n = 132, P < 0.001) and was negatively affected by the warming and warming + drying climate treatments (n = 44, P = 0.044, 0.045, respectively), as well as the burned treatment (n = 66, P < 0.001). The native grass cover trend lines for both climate treatments occlude each other for the burn and unburned treatments

