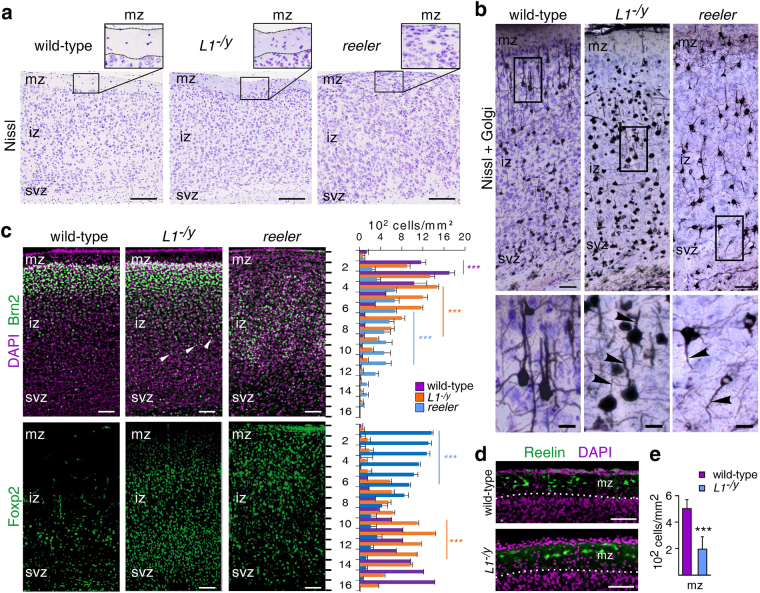
Figure 6.
L1-deficient mice show deficits in positioning of cortical neurons and reduced number of Cajal-Retzius cells. (a) Nissl-staining of cerebral cortices from 6-day-old wild-type and L1-deficient (L1 −/y) littermates shows a cell-poor marginal zone (mz) followed by an intermediate zone (iz) and subventricular zone (svz). In contrast, the mz in the cerebral cortex of reeler mice contains by more neurons; scale bars: 100 µm. (b) Nissl staining combined with Golgi impregnation on cerebral cortical sections from 24-day-old wild-type and L1 −/y littermates in comparison to reeler mice of the same age (low magnification images are shown in the upper panels, scale bars: 50 µm; magnified areas are indicated by rectangles and presented in the lower panels, scale bars: 10 µm). (c) The left panels show cerebral cortical sections from wild-type, L1-deficient (L1 −/y) and reeler mice after immunostaining for Brn2 or Foxp2 (green) in combination with nuclear staining (DAPI, violet). White arrowheads show misplaced neurons; scale bars: 50 µm. The right panels show mean values + SEM for the numbers of Brn2- and Foxp2-positive cells in 16 cortical bins along the mz-svz axis analysing 12 sections of the same area from 4 animals per condition (***p < 0.0001; One-way ANOVA with Tukey’s Multiple Comparison Test; violet asterisks: differences between wild-type and reeler neurons; orange asterisks; differences between L1-deficient and wild-type neurons; blue asterisks: differences between reeler and L1-deficient neurons). (d) Immunostaining for Reelin (green) using antibody G10 revealed a reduced number of Cajal-Retzius cells in the mz of L1-deficient cortex when compared to wild-type littermates. Nuclear staining (DAPI, violet); scale bars: 100 µm. Mean values + SEM are shown for the numbers of Cajal-Retzius cells in the mz analysing 12 sections of the same area from 4 animals per condition (***p < 0.001; Student’s t-test).

