Figure 7.
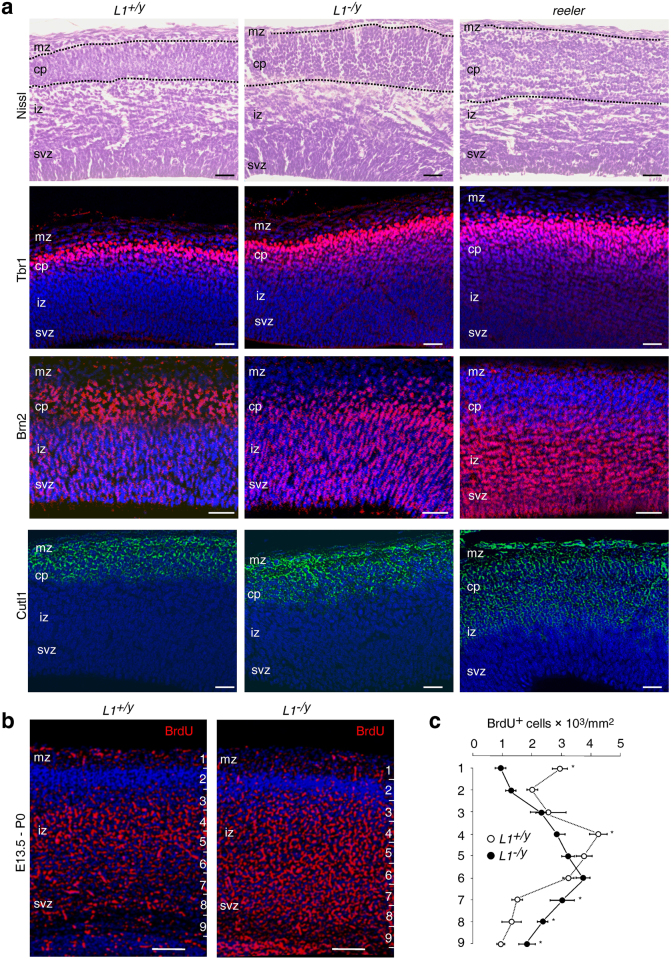
Histological analysis of embryonic wild-type, L1-deficient and reeler brain cortex sections and BrdU pulse chase labelling. (a) Nissl staining and layer-specific immunostaining of cortical sections of reeler, L1-deficient (L1 −/y) and wild-type (L1 +/y) mice at embryonic day 15; dashed lines indicate the area of the cortical plate (cp). Note that the L1 −/y cp appeared less compactly developed in comparison to the L1 +/y cp. The distribution of Tbr1-positive (red), Brn2-positive (red) and Cutl1-positive (green) cells in the L1 −/y cortex was slightly altered in comparison to the L1 +/y cerebral cortex, but these abnormalities were not as extensive as the misplacement of cells seen in the reeler cortex. Nuclear staining with DAPI (blue); mz, iz, svz: marginal, intermediate and subventricular zones; scale bars: 50 µm. (b,c) Altered distribution of BrdU-positive cells in the cerebral cortex of L1 −/y mice. A single BrdU dose (150 mg/kg) was injected intraperitoneally into timed-pregnant females carrying 13.5-day-old L1+/y and L1−/y embryos. Immunohistology for BrdU (red) was performed at birth (P0). The cerebral cortex was divided in 9 equidistant bins and the number of BrdU+ cells per mm2 was estimated for each bin (right); scale bars: 50 µm. Mean values ± SEM are shown for the numbers of BrdU-positive cells per mm2 analysing five sections from three animals per condition (*p < 0.05; Mann-Whitney U-Test).

