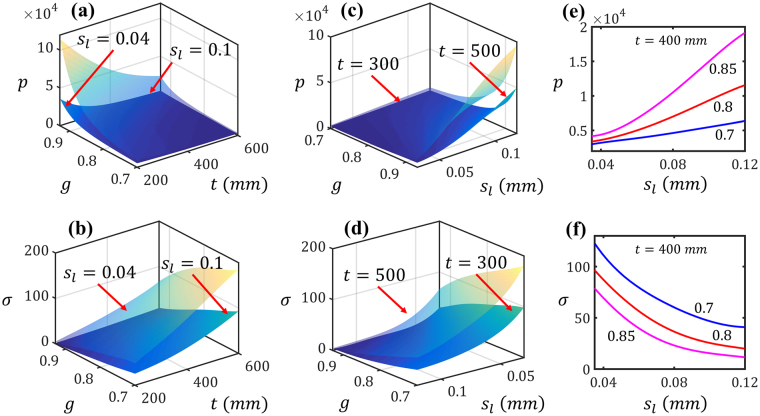
Figure 4.
Effect of the characteristics of tissue samples (i.e., ) on the characteristics of scattering patterns (i.e, ): The effect on the transmittted power and the scaled Gaussian width are demostrated in the figures in, respectively, top and bottom rows. In (a) through (d), either t or μ is fixed and the outputs are plotted versus the other two inputs. In (e) and (f), p and σ are plotted versus μ for three values of g while having t fixed to 400 mm.

