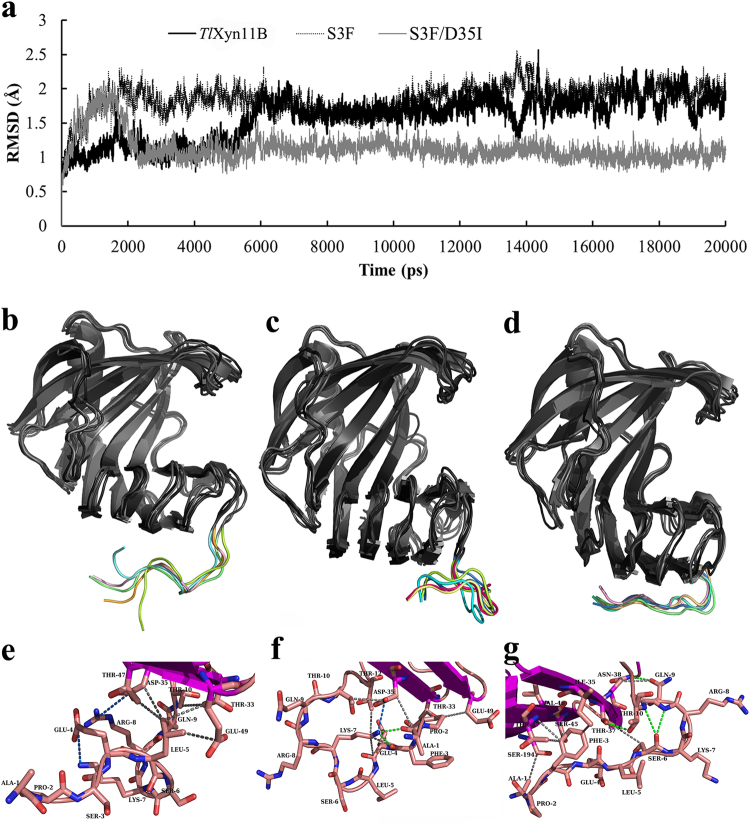
Figure 4.
Structure analysis of TlXyn11B and its mutants S3F and S3F/D35I. (a) The RMSD values determined by the MD simulation. (b,c,d) Structure alignment of the five frames (one frame per ns in the last 5 ns) of TlXyn11B, S3F, and S3F/D35I, respectively. (e,f,g) Local interactions of TlXyn11B, S3F, and S3F/D35I predicted by the Ring web server. The salt bridges, hydrogen bonds and Van der Waals’s interactions are indicated by blue, green and gray lines, respectively.

