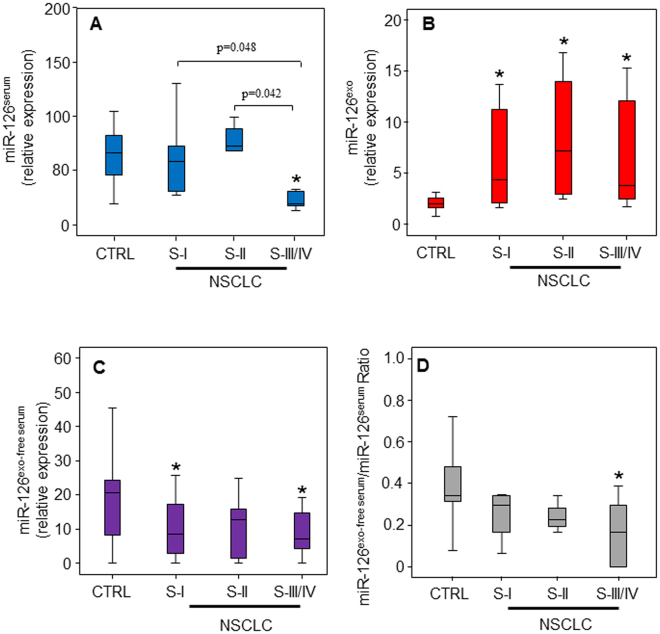
Figure 2.
Distribution of miR-126 in serum, exosomes, and exosome-free serum in relation to tumour stage. Relative levels of miR-126 in serum (A), exosomes (B) and exosomes-free serum (C) in healthy control group (CTRL) and NSCLC patients of individual. (D) The ratio of circulating miR-126 in exosomes-free serum and serum of CTRL subjects and NSCLC patients at different tumour stages is shown. Statistical analyses were performed using one-way analysis of variance (ANOVA), with Tukey post-hoc analysis. The symbol “*” indicates significant differences compared to control with p < 0.05.

