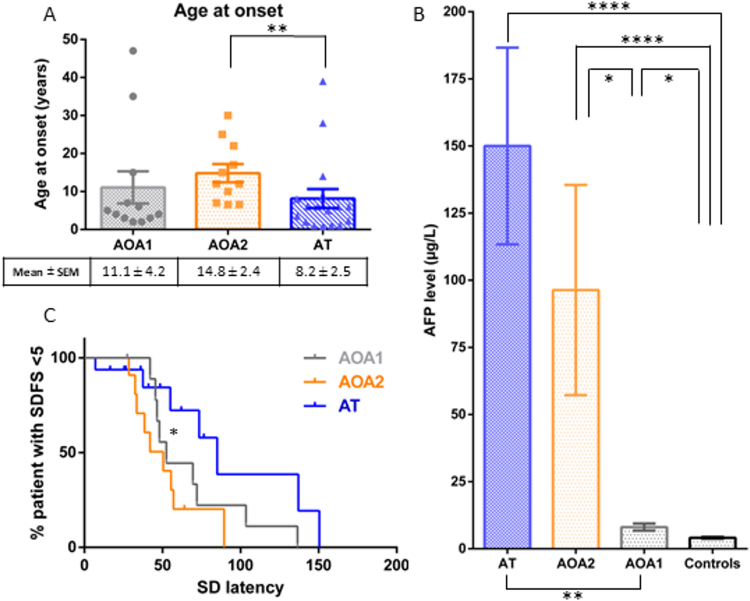
Figure 1.
Ages at onset (1A), AFP serum levels (1B) and variability of latencies in respect of disease progression (SDFS) (1C) in AOA1, AOA2 and AT patients. Individual symbols (dots, triangles, squares) represent each patient’s age at onset (1 A), bar graphs represent the mean; upper and lower error bars represent standard error of the mean (1 A and 1B). *p < 0.05; **p < 0.01 and ****p < 0.0001 significant differences. Abbreviations: AFP: Alpha-fetoprotein; AOA1: ataxia with oculomotor apraxia type 1; AOA2: ataxia with oculomotor apraxia type 2; AT: Ataxia Telangiectasia;; SDFS: Spinocerebellar degeneration functional score.

