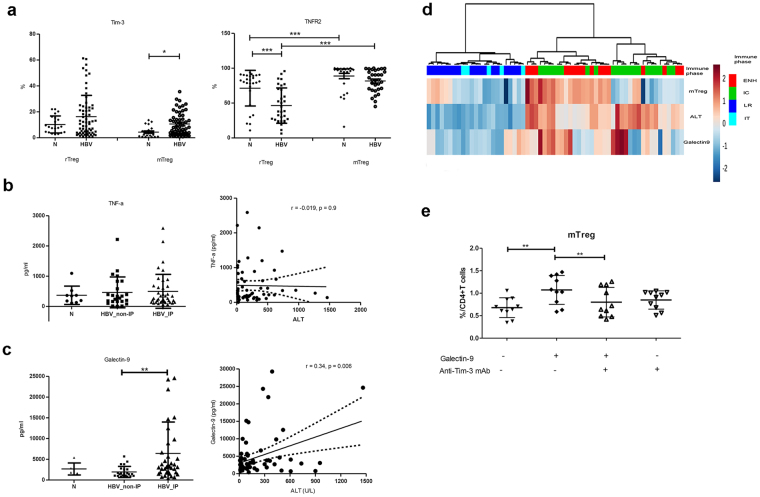
Figure 5.
Galectin-9, but not TNF-α, was increased in the plasma of chronic HBV patients in the IC and ENH phase, and was associated with expansion of mTregs. (a) Proportion of Tim-3 and TNFR2-expressing rTregs and mTregs of CHB patients in IC and ENH phase and healthy volunteers. (b) Serum levels of TNF-α of healthy volunteers and HBV patients. (c) Serum levels of galectin-9 of healthy volunteers and HBV patients. (d) Unsupervised hierarchical clustering using Euclidean distance. Dendrogram displays similarities between clusters. Increasing color intensity (blue- >red) corresponds to increasing mTreg frequency, serum ALT or galectin-9 levels in CHB patients. (e) The addition of galectin-9, anti-Tim-3 mAb, and galectin-9 plus anti-Tim-3 mAb at day 0 of culture with purified CD4+T cells. Anti-Tim-3 mA blocked the induction mTregs expansion. Error bars denote the mean ± standard deviation. *p < 0.05; **p < 0.01; ***p < 0.001.

