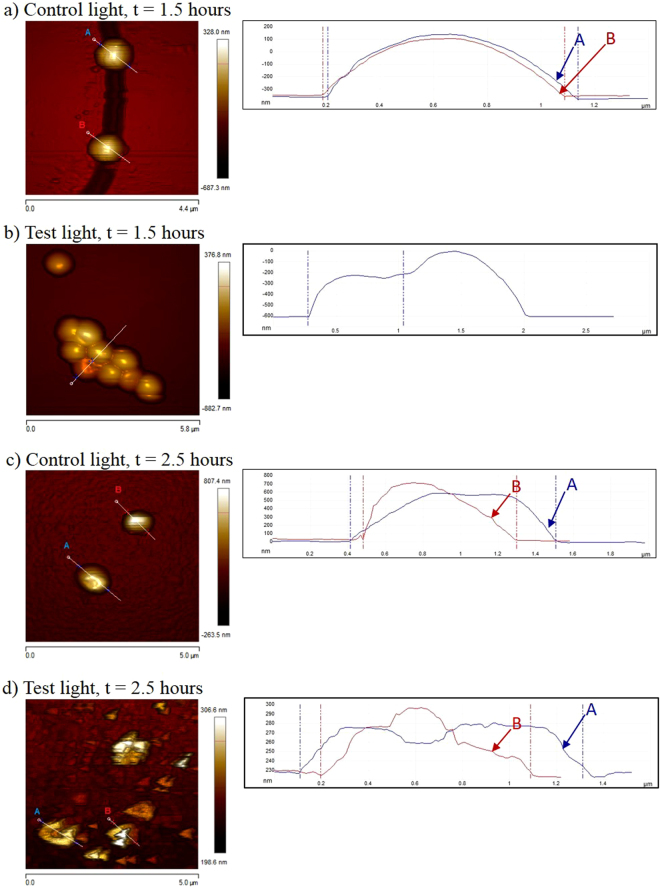
Figure 4.
Height sensor AFM images and their cross-sectional analyses of S. epidermidis cells on test and control surfaces in the presence of light. (a) Shows the cells after 1.5 hours of treatment on the control surface (scale bar = 4.4 μm); (b) shows the cells after 1.5 hours of treatment on the test surface (scale bar = 5.8 μm); (c) shows the cells after 2.5 hours of treatment on the control surface (scale bar = 5.0 μm); and (d) shows the cells after 2.5 hours of treatment on the test surface (scale bar = 5.0 μm).

