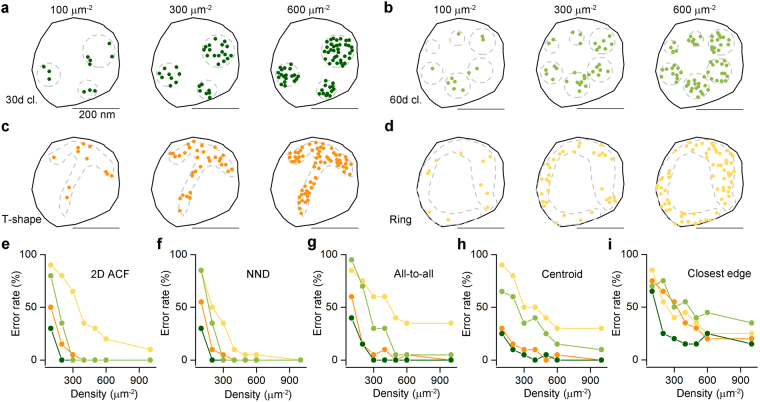
Figure 1.
Assessing different measures for discriminating clustered patterns of localization points from random distributions using Monte Carlo simulations. (a) Representative multiple-cluster models with localization densities ranging from 100 μm−2 to 600 μm−2, from left to right. The cluster density is 30 μm−2. The dashed grey line delineates the circular areas within which localization points are placed randomly. (b) As for a, but the density of the clusters is 60 μm−2. (c) Representative T-shaped models with localization densities ranging from 100 μm−2 to 600 μm−2, from left to right. (d) As for c, but for ring-shaped models. (e–i) Error rates calculated from 20 models, which are individually compared to 200 random distributions. Models with their computed parameter falling <2.5% and >97.5% of that of the random distributions were considered ‘significantly’ different from random. The error rates are plotted as a function of localization densities and are shown for the 5 different measures on the 4 different clustered patterns: ‘2D ACF’: 2D autocorrelation function (e); ‘NND’: nearest neighbor distances (f), ‘all-to-all’: distance of all localization points to all other localization points (g); ‘centroid’: distance of each point from the center of mass of the localization points (h); ‘closest edge’: distance of each point from the closest edge of the structure delineating polygon (SDP, i).

